
Reclamation’s Lake Mead Elevation Forecasting Record
The Bureau of Reclamation and interested parties are at work assessing proposed triggers for imposing cutbacks in the delivery of Colorado River water to water right holders. Putting aside (for now) the specifics of proposals, Hydrowonk examines Reclamation’s “track record” of forecasting Lake Mead elevations. From a policy perspective, the more accurate forecasts driving decisions, the more effective water resource management decisions are.
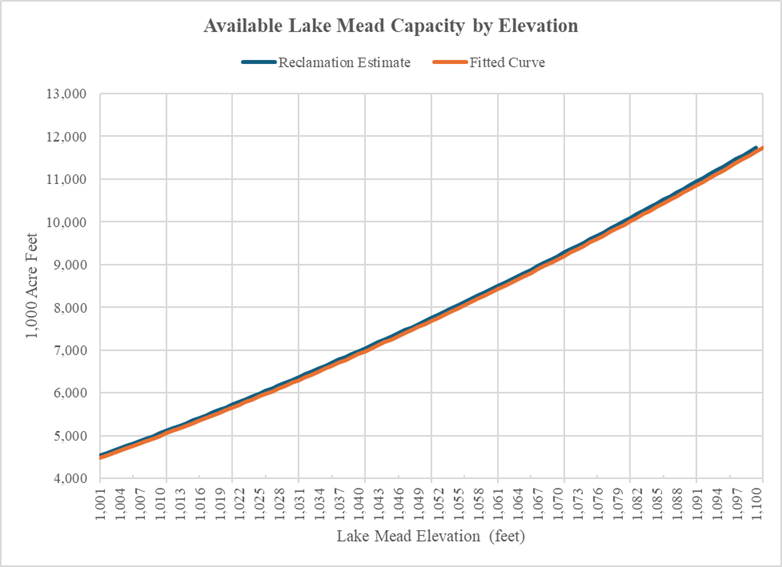
The discussion of post-2026 triggers has moved from basing cutbacks on lake elevations to the amount of water in storage. For Lake Mead, these are two sides of the same coin (see chart). The line “Reclamation Estimate” plots the available capacity of Lake Mead above Dead Pool (895 feet) by Lake Mead elevation. The line “fitted curve” is an estimated statistical model relating Reclamation’s estimate of available Lake Mead capacity to a “quadratic model” based on Lake Mead’s elevation, where the increase in available storage increases at an increasing rate with the elevation of Lake Mead. (STAT/NERD ALERT! The model includes the elevation and the elevation squared as explanatory variables). Two peas in a pod.
Hydrowonk understands the attractiveness of discussing triggers in terms of the amount of water in storage rather than lake elevation. However, lake elevations are measured. The amount of water in storage is not measured but estimated (presumably based on lake elevation). Therefore, Reclamation’s track record in forecasting Lake Mead elevation will provide insight into the accuracy of forecasted amount of water in storage.
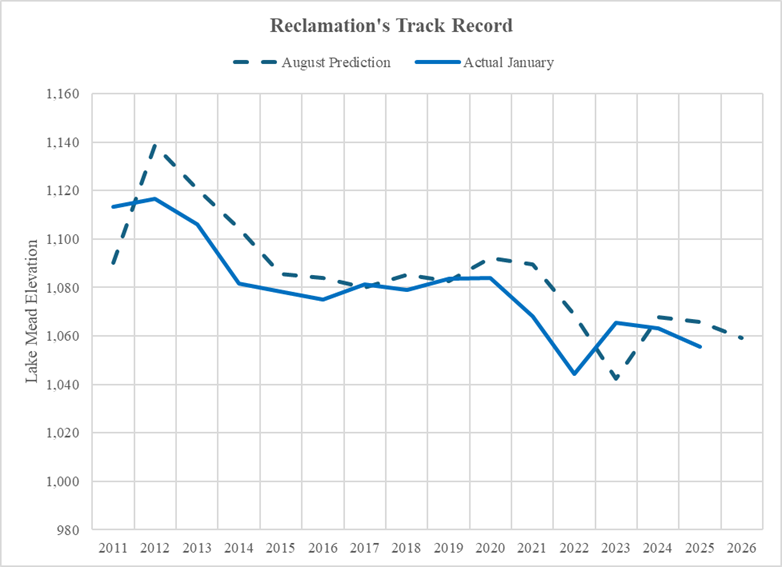
Reclamation track record shows an ability to identify the fluctuating downward trend in Lake Mead’s January elevations (see chart). The “August Prediction” line is from Reclamation’s 24-month study released in August of the prior year. The “Actual Elevation” line is the record elevation of Lake Mead on January 1st of indicated year. They generally move together (correlation is 0.78). Reclamation’s forecast was higher than the actual January elevation in eleven of the fifteen years (by an average of 14 feet) and lower in four of the fifteen years (by an average of 8 feet). Lake Mead’s actual January elevation was seven feet lower on average than forecasted by Reclamation from 2011-2025.
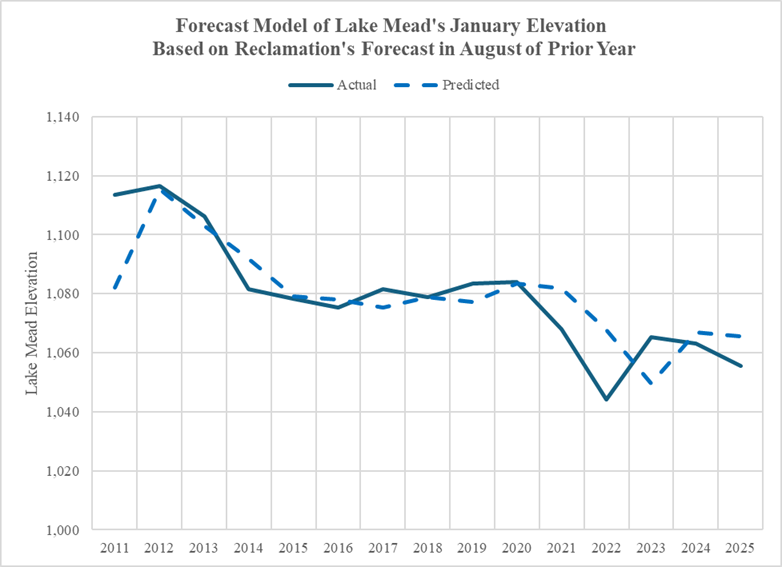
Another way to look at Reclamation’s forecast record is to assess how informative its August forecast for next January’s Lake Mead elevation is in predicting next year’s actual January Lake Mead elevation (see chart). For each one-foot increase in Reclamation’s forecast of the January Lake Mead elevation, the actual January elevation increases by 0.68 feet. The average forecast error is zero. Given Reclamations August forecast of 1,059.28 feet for January 2026, Hydrowonk’s model’s forecast is 1,061.09 feet. Both approaches support the Tier 1 shortage declaration.
Whenever one forecasts the future, forecast errors are inevitable. No one is clairvoyant (especially about hydrologic conditions). For Reclamation’s August 2025 forecast of a January 2026 Lake Mead elevation at 1,059.28 feet, Hydrowonk’s forecast has material uncertainty (see chart).
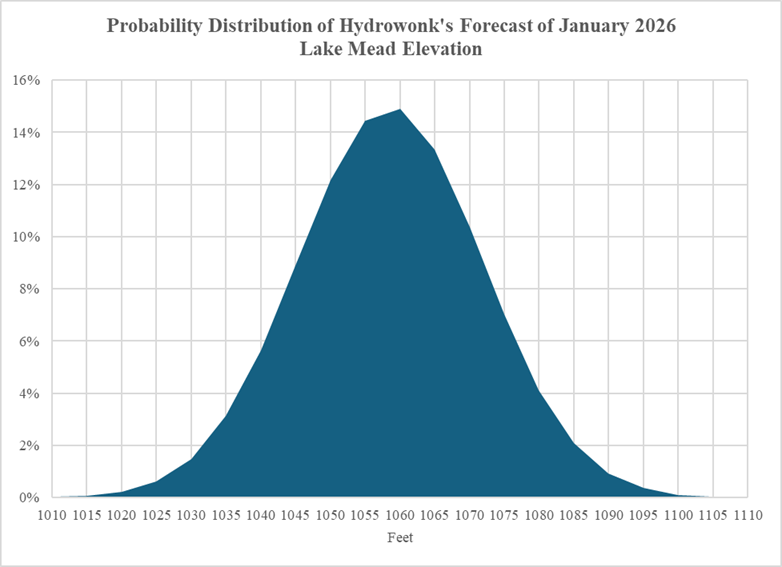
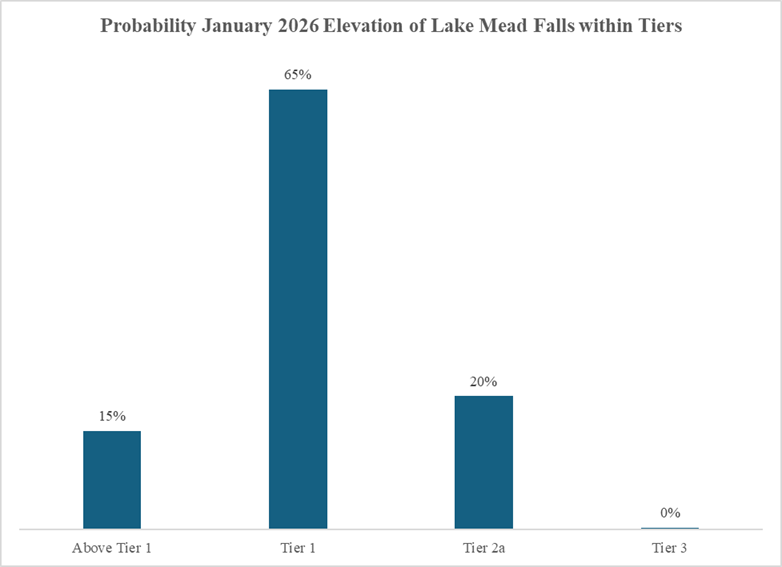
Given the above uncertainty, what is the risk that actual January 2026 elevations are in different trigger tiers than Tier 1? See chart. Hydrowonk’s forecast predicts the probability that the actual January 2026 elevation falls within Tier 1, Tier 2a, and Tier 0 is 65%, 25% and 15% respectively. The probability that the actual January 2026 elevation falls into Tier 3 is zero.
As the future evolves, of course, Lake Mead’s elevation will follow a future, unknown course. As elevations hover near trigger thresholds, relying solely on “Most Probable Inflow Scenarios” ignores the growing underlying uncertainty of projections.
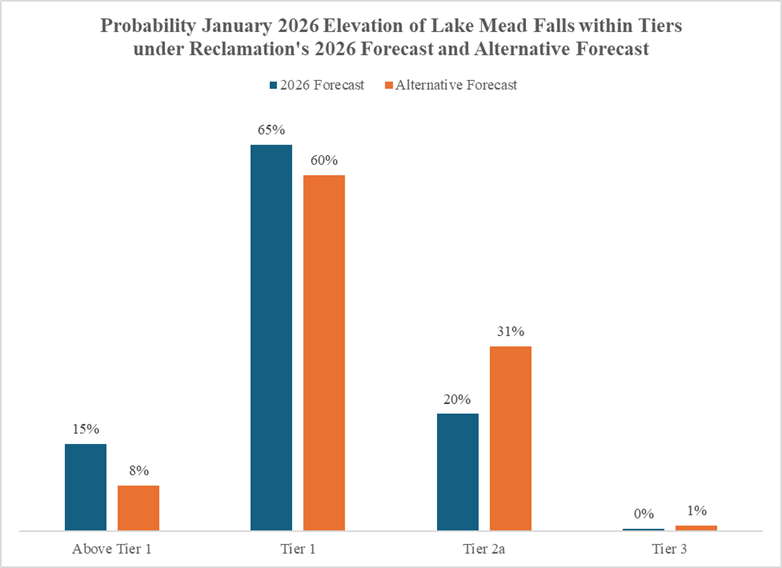
Suppose Reclamation’s forecast was 1,052 feet for January 2026, just above the threshold for a Tier 2a declaration. In this circumstance, the probability that the actual January 2026 elevation falls within Tier 1, Tier 2a, and Tier 0 is 60%, 31% and 8% respectively, with the probability that the actual January 2026 elevation falls into Tier 3 is 1% (see chart). While both forecasts trigger a Tier 1 shortage, a professional risk manager would not see the alternatives as comparable. The march to Tier 2a shortages is more likely to occur under the alternative forecast than Reclamation’s 2026 forecast.
What is missing? Placing Reclamation’s forecasts within a risk management structure. What would this look like? Stay tuned.